Original Link: https://www.anandtech.com/show/6674/getting-the-best-out-of-an-ivy-bridge-htpc-windows-8-madvr-and-more
Getting the Best out of an Ivy Bridge HTPC: Windows 8, madVR and More..
by Ganesh T S on January 20, 2013 3:00 PM EST- Posted in
- Intel
- Home Theater
- HTPC
- Ivy Bridge
- Windows 8
- Passive Cooling
Introduction
The build process and thermal performance of a fanless Ivy Bridge HTPC was covered in detail last month. I had indicated that the piece would be the first of a three-part HTPC series. Today, we are looking at the second part of the series. My original intention was to present the HTPC oriented benchmarks and aspects of the PC as it was built in the first part.
After a few experiments, we had to do some updates to the build in terms of both hardware and software (OS). The first hint of trouble came when I was unable to reproduce the performance of the i7-3770K Ivy Bridge HTPC with respect to madVR despite having DRAM running at 1600 MHz instead of 1333 MHz. The second was more of a decision to test out what Windows 8 offers to HTPC users. As you will see in later sections, Windows 8 offers a host of advantages to the HTPC user while also presenting some roadblocks.
In our initial build, we had avoided filling up the second DRAM slot because the DRAM heat sink ended up scraping against the capacitors in the Nano150 PSU. Unfortunately, this meant that we had halved the memory bandwidth available to the processor. madVR, in particular, is very sensitive to bandwidth constraints. We fixed this by deciding to allow the heat sink to touch the capacitors and ended up increasing the installed memory from 4 GB to 8 GB. In order to install Windows 8, we added another SSD to the system and set the unit up in a dual boot configuration with both Windows 7 and Windows 8. We were able to perform sensible power consumption comparisons between the two operating systems in this scenario (same hardware and software configuration except for the OS itself).
In the rest of the piece, we will be looking at the general performance metrics, network streaming performance (Netflix and YouTube), refresh rate handling, HTPC decoding and rendering benchmarks for various combinations of decoders and renderers and revisit the power consumption and thermal profile of the system. Before proceeding further, the table below summarizes the hardware and software configuration of the unit under consideration.
| Ivy Bridge Passive HTPC Configuration | |
| Processor |
Intel Ivy Bridge Core i3-3225 (2 x 3.30 GHz, 22nm, 3MB L2, 55W) |
| Motherboard | Asus P8Z77-I Deluxe |
| Memory | 2 x 4GB DDR3-1600 [ G-Skill Ares F3-2133C9Q-16GAB ] |
| Graphics |
Intel HD Graphics 4000 650 MHz / 1.15 GHz (Turbo) |
| Disk Drive(s) |
Corsair F120 120 GB SSD OCZ Vertex 2 128 GB SSD |
| Optical Drive | Blu-ray/DVDRW Combo (Philips Lite-On DL-4ETS) |
| Networking |
Gigabit Ethernet 802.11b/g/n (5GHz/2.4GHz Dual-Band access) / Bluetooth 4.0 (2T2R Broadcom BCM43228 in AzureWave AW-NB111H) |
| Audio |
Microphone and headphone/speaker jacks Capable of 5.1/7.1 digital output with HD audio bitstreaming (optical SPDIF/HDMI) |
| Operating Systems |
Windows 7 Ultimate x64 Windows 8 Professional x64 |
General Performance Metrics
We are not going to compare our build with full-blown desktop solutions. Instead, we will see how the unit stacks up to some of the low power offerings that have graced our labs. Some of the benchmarks have been run for the first time, and hence, not all benchmarks are available for all units. In addition, we are only presenting benchmark results for our build under Windows 8.
Windows Performance Index
This metric is often considered meaningless, but we feel it serves as an indicator of what could be the bottleneck in a system. On Windows 8, systems can score up to 9.9 on this metric, compared to 7.9 on Windows 7.
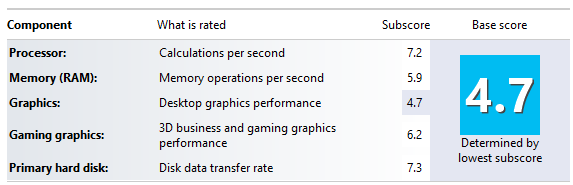
Given that we have equipped the system with SSDs and the RAM runs at the prescribed maximum of 1600 MHz, it is no surprise that the HD 4000 GPU is responsible for a score of 4.7 for the system.
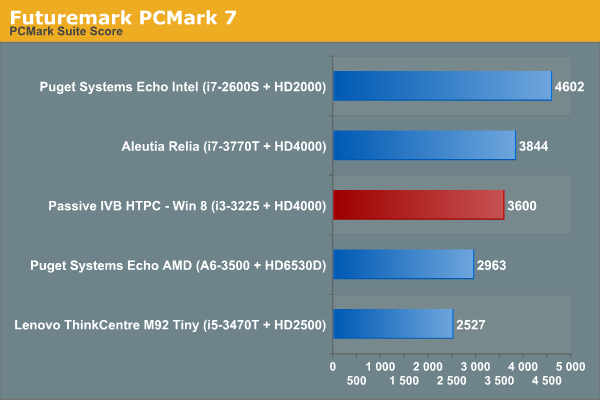
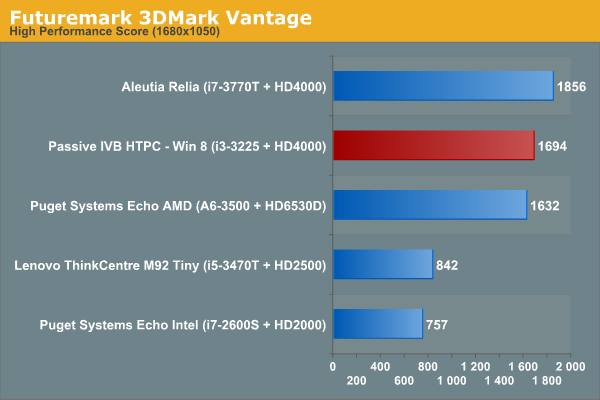
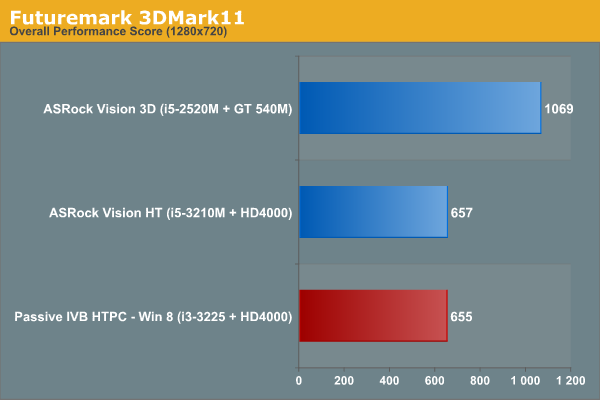
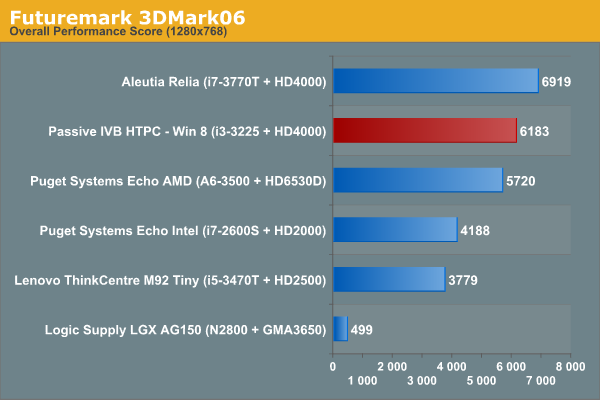
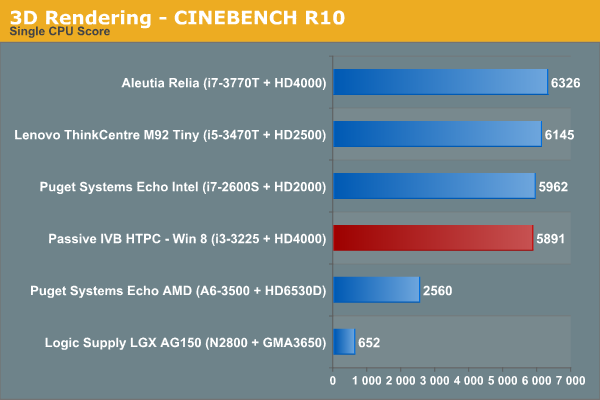
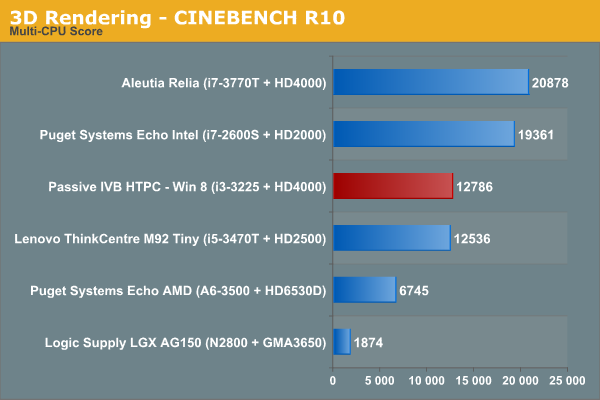
Futuremark Benchmarks
Miscellaneous Benchmarks
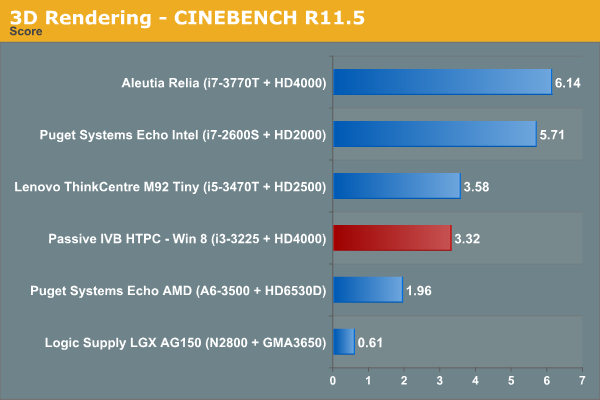
Starting with this review, we are going to utilize Graysky's x264 Benchmark v5.0 for testing out x264 encoding performance. Instead of just presenting benchmarks for our build alone, we took the opportunity to run the benchmark on two HTPC units we reviewed earlier.
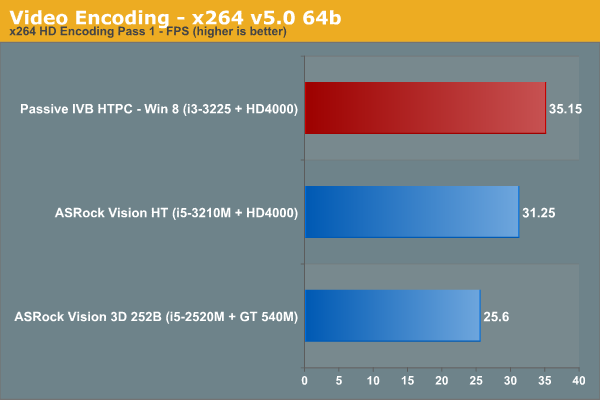
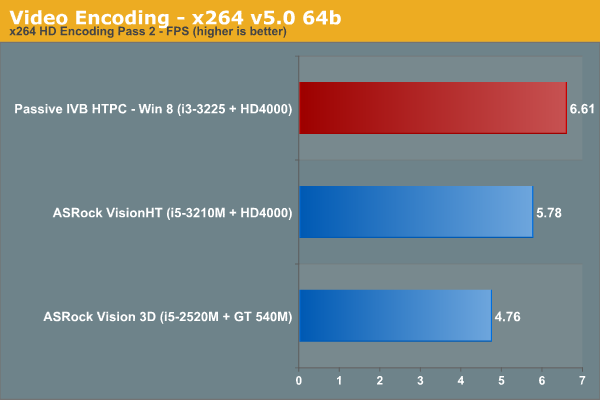
There are no surprises in the benchmarks, with the CPU performance befitting a 55W TDP unit. The absence of four physical cores does hurt it against the i7-based units in the above graphs (and would have showed in the x264 benchmark too, if we had run it on a i7-based system). However, this is not a concern for most HTPC workloads.
Network Streaming Performance - Netflix
The drivers for the Intel HD 4000 enable hardware accelerated decode and rendering for Netflix streams in Silverlight on Windows 7. The Windows 8 Netflix app has been a bit of a mystery where it is not readily evident as to whether hardware acceleration is present or not, and whether it is being really utilized. In this section, we will take a look at how Netflix behaves on Windows 7 and Windows 8. The ISP at my location is Comcast, and unfortunately, there is no access to the Netflix 5 Mbps Super HD streams yet.
Netflix on Windows 7
On Windows 7, Netflix needs the Silverlight plug-in to be installed. We played back our standard test stream using Internet Explorer.
The Silverlight plug-in attempts GPU acceleration and enables it on our system. Manual stream selection is available. The maximum playback quality has a bitrate of 64 kbps for the audio and 3 Mbps for the video.

We will take a look at the efficiency of the system while playing back the stream towards the end of this section.
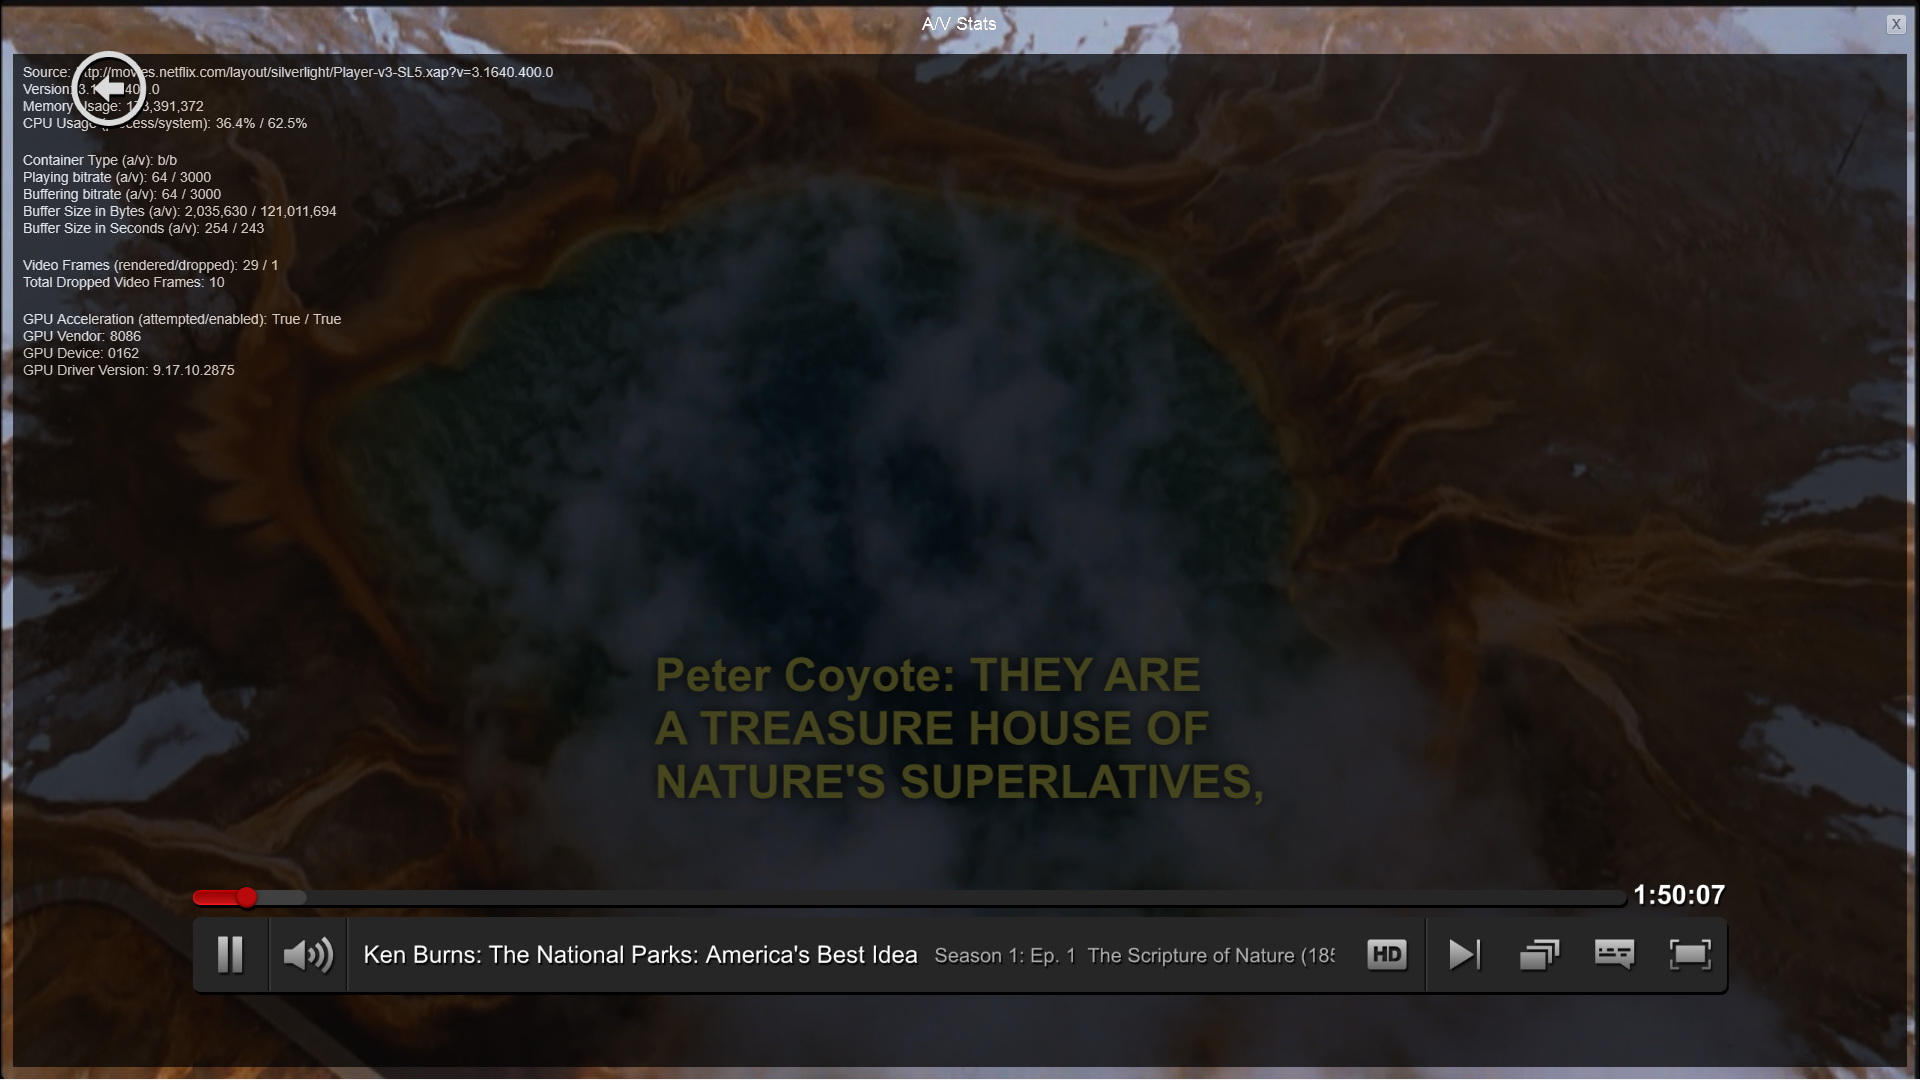
Netflix on Windows 8
On Windows 8, Netflix is streamed through a Metro app. Fortunately, the same debug shortcut keys used in the Silverlight version work here too. A nice add-on touch is that the manual stream selection and playback statistics OSD can be made to appear simultaneously.
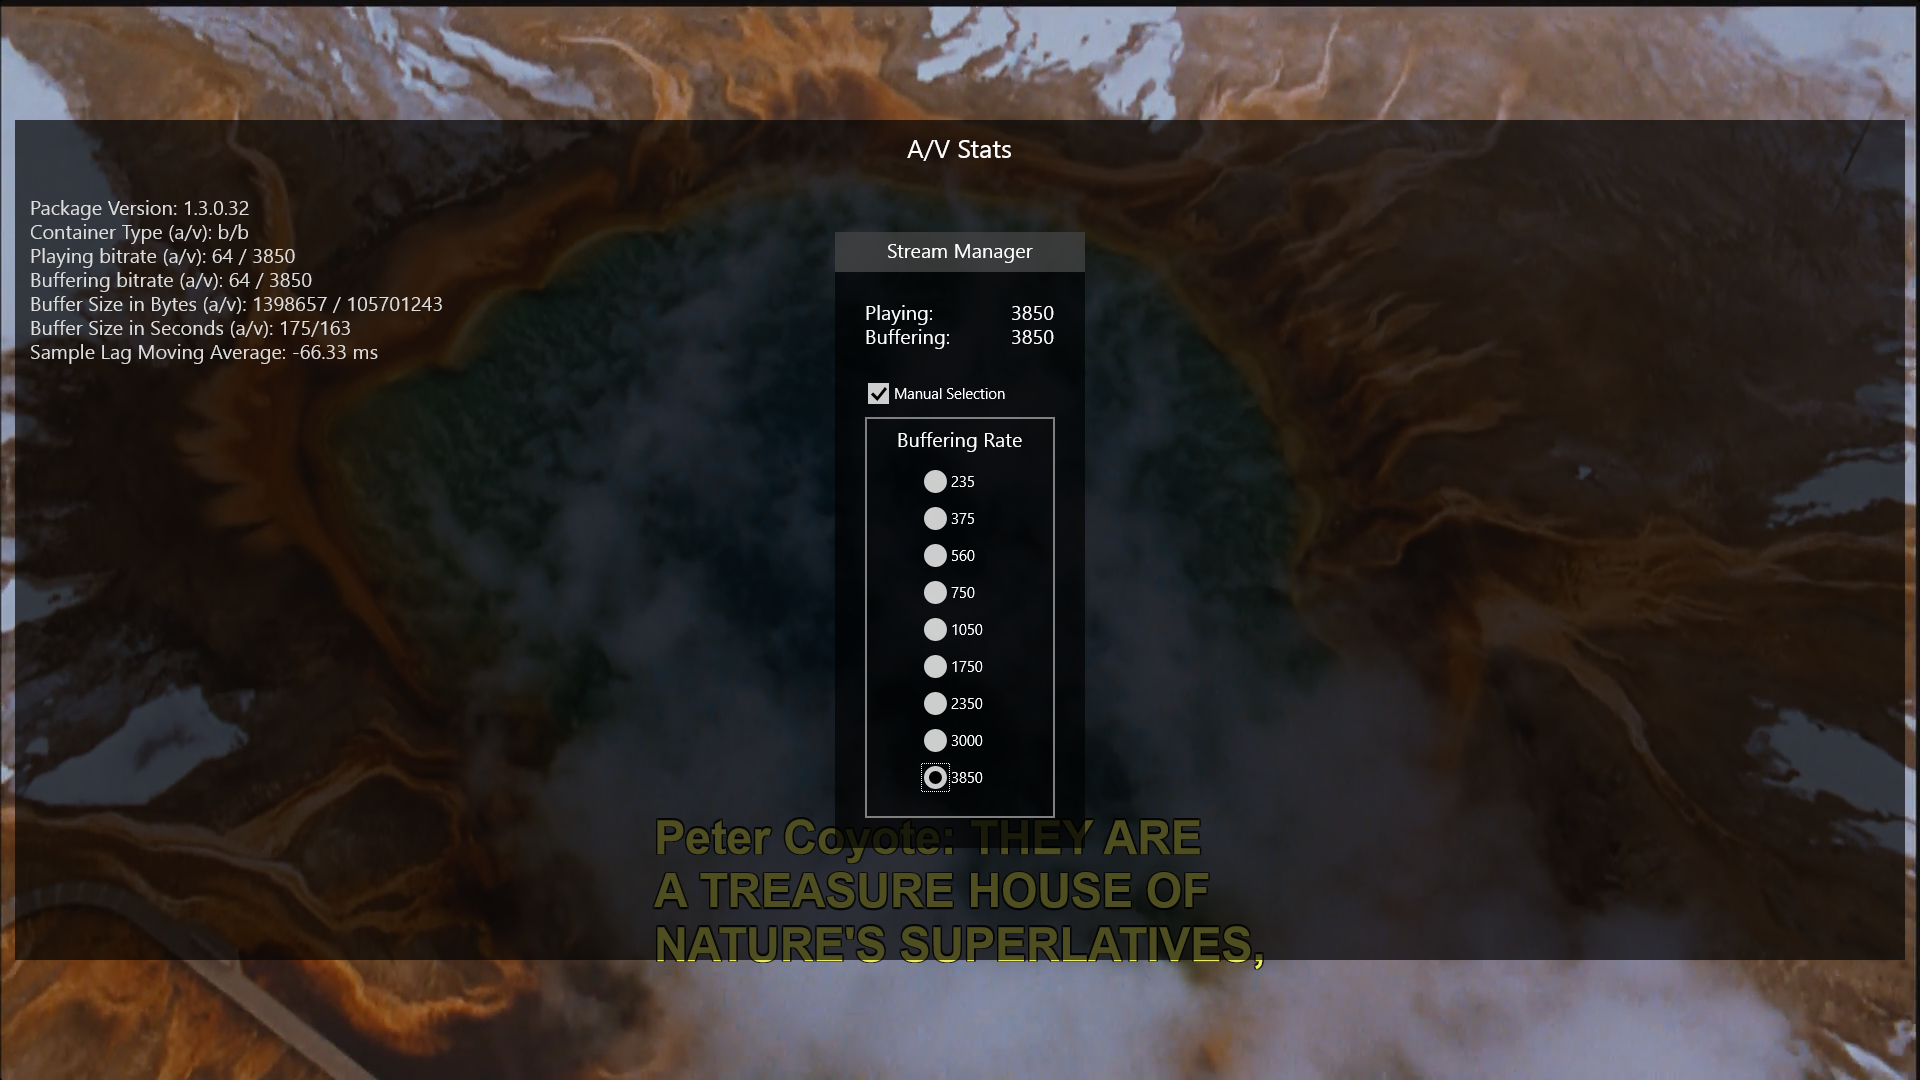
It is not immediately evident as to whether hardware acceleration is being utilized or not. However, the aspect which stands out immediately is the fact that the video playback bitrate can go as high as 3.85 Mbps. Audio still remains at a lowly 64 kbps. Hopefully, a future update to the Netflix app can provide us with the soundtracks available on specialized media streamers.
Netflix Power Consumption - Windows 7 vs Windows 8
While the Silverlight plug-in OSD helpfully reports that GPU acceleration is being taken advantage of, it doesn't indicate the efficiency in any way. On the other hand, the Windows 8 app doesn't report GPU acceleration status at all. To determine the actual efficiency of Netflix playback, we recorded power consumption at the wall for both scenarios over a 10 minute interval during the middle of the stream.
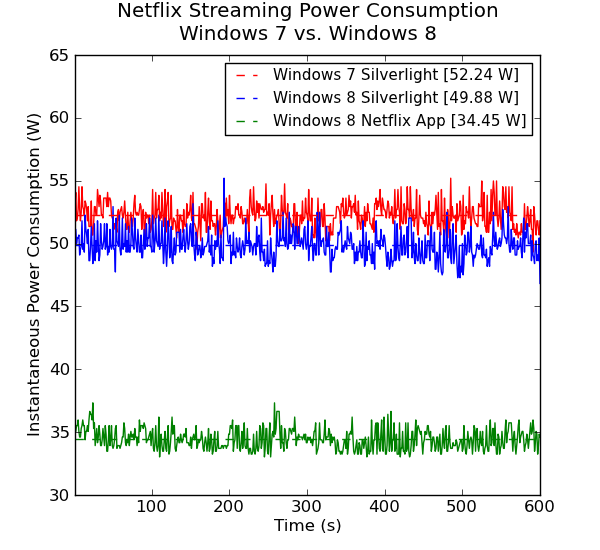
The graph presents some very interesting results. With Windows 8, the system consumes much less power and the stream is also of higher quality. GPU acceleration in the app makes the streaming more than 30% efficient when compared to the Silverlight version. Compared to Windows 7 Silverlight, the Netflix app is efficient by approximately 35%. Windows 8, by itself, seems to consume less power too. Considering these results, if Netflix forms any part of your HTPC usage scenario, it is a no-brainer to upgrade from Windows 7 to Windows 8.
Network Streaming Performance - YouTube
YouTube is one of the most popular video streaming services, and Google maintains a number of encodes for each stream. On platforms supporting Adobe Flash, FLV streams are available at resolutions ranging from 240p to 480p. HTML5 streams are either in WebM (for Firefox) or MP4 / H.264 (for Internet Explorer). WebM streams typically top out at 720p, while MP4 is the preferred format for 1080p. At higher resolutions, Adobe Flash also streams the MP4 version.
As expected, we get GPU acceleration when using Adobe Flash in Firefox on Windows 7. The debug OSD presents the requisite details.

HD YouTube Streaming using Adobe Flash in Mozilla Firefox on Windows 7
Windows 8 has an app for YouTube, 'YouTube Player' which allows for stream quality selection. Just like the Netflix app, there is no direct way to determine if GPU acceleration is being used.
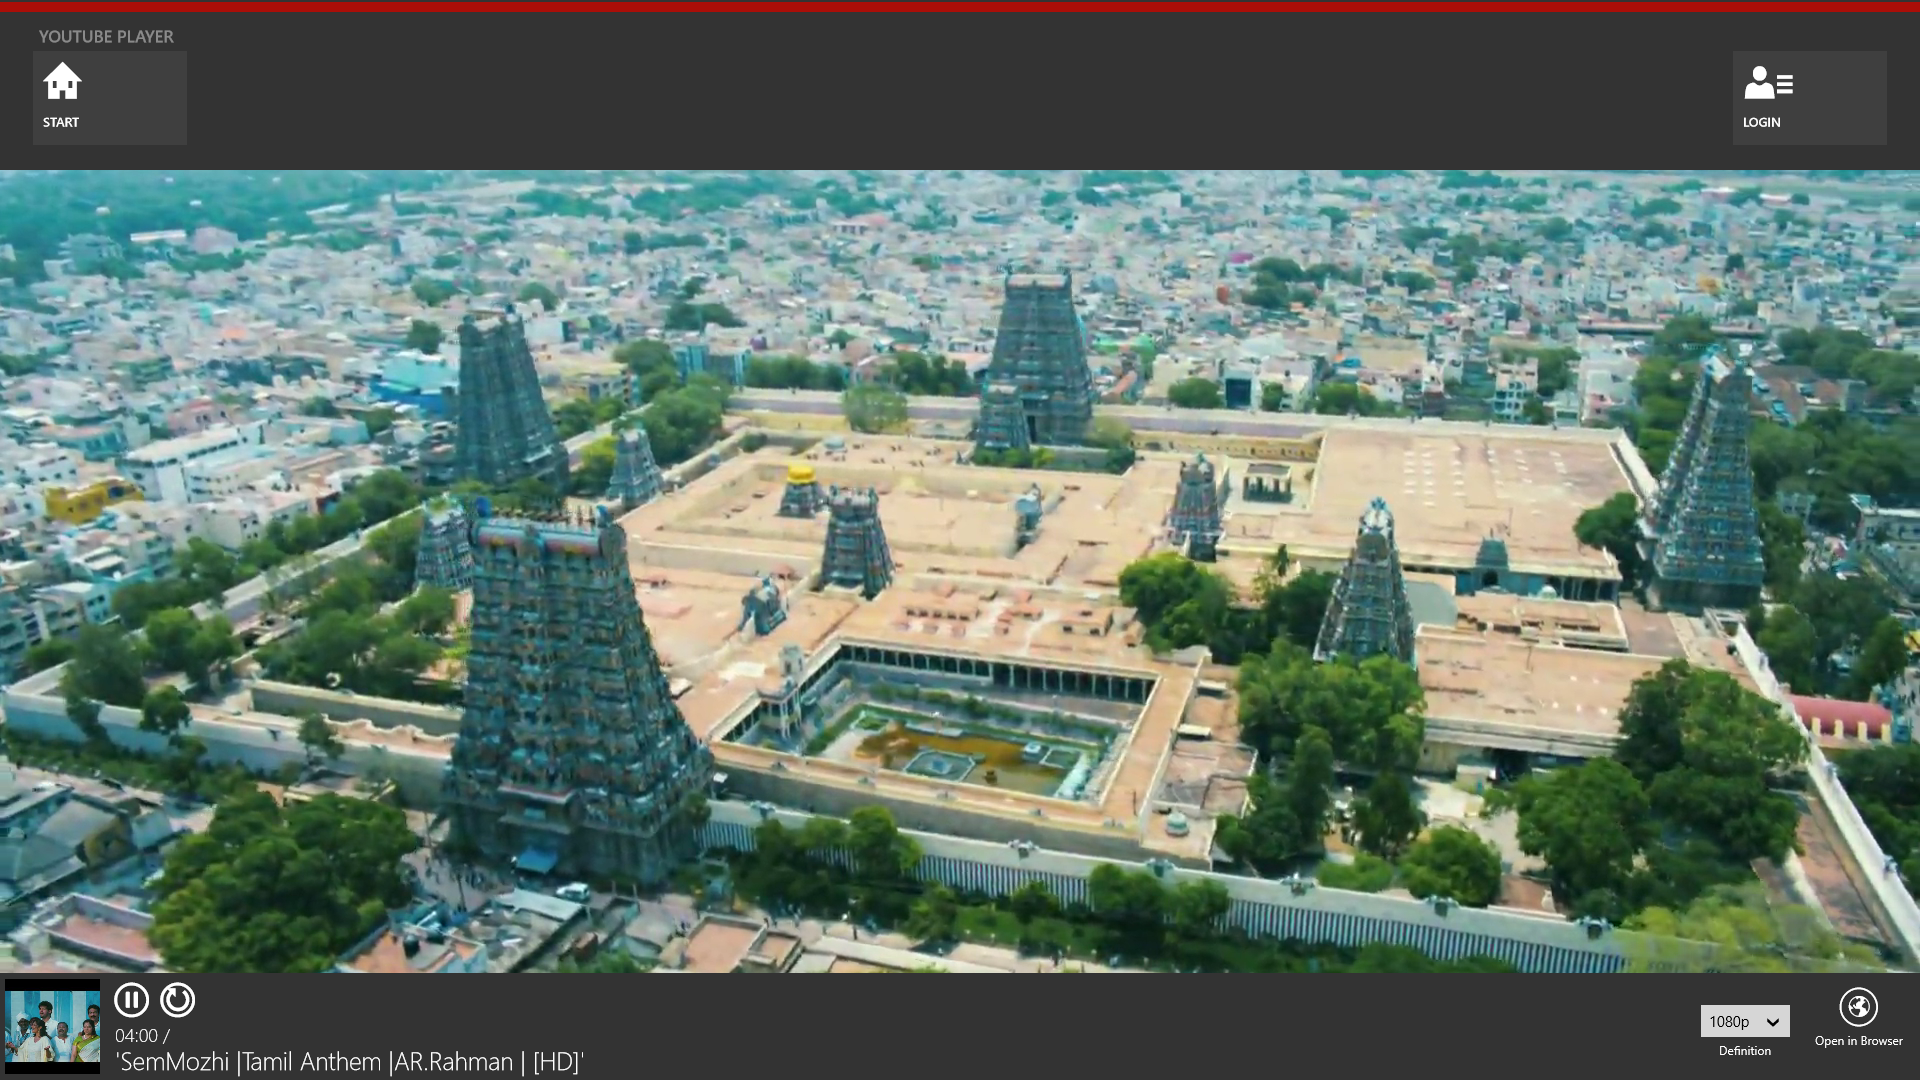
HD YouTube Streaming using the YouTube Player App on Windows 8
We will rely on the power consumption at the wall to determine the efficiency of various ways to stream YouTube videos across different operating systems. Since the matrix of options is quite big, we present the graphs one at a time. All the graphs are on the same scale. Press the button below corresponding to the combination you want to compare the current graph against.
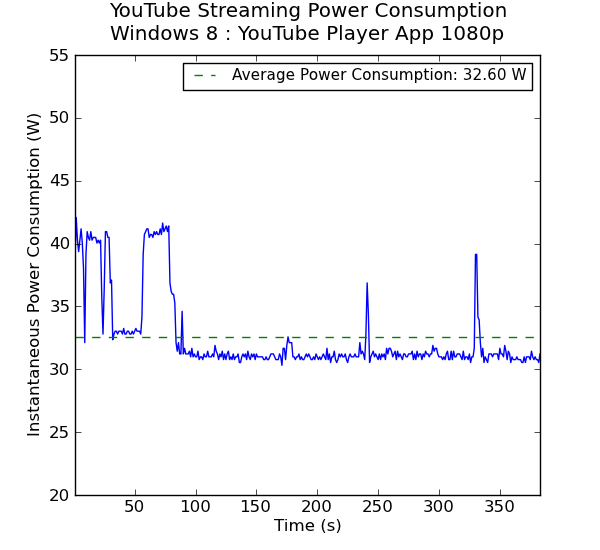
It can be seen that the Windows 8 YouTube Player App wins hands down. The stream being decoded is, in all probability, the 1080p H.264 version. Even when Adobe Flash is being used, Windows 8 seems to be more efficient compared to Windows 7. If you are on Windows, and prefer to use HTML5, it is better to avoid Mozilla Firefox because the WebM version consumes the most power at the wall (due to lack of hardware accelerated decode) while providing only a 720p stream. Once again, if YouTube forms a major part of your HTPC experience, an upgrade from Windows 7 to Windows 8 can be recommended.
Refresh Rate Handling
Readers following our HTPC reviews know by now that Intel's 23 Hz issue will remain unresolved in Ivy Bridge. It is definitely better than the Clarkdale days, as users no longer get 24 Hz when setting the display refresh rate to 23 Hz (23.976 Hz intended). Our system is not immune to this issue either, and setting 23 Hz in the refresh setting gives us a refresh rate of 23.972 Hz. This is slightly worse than what we got with the ASRock Vision HT.

Intel doesn't provide 25 Hz refresh rate support even on supported displays. The other refresh rates that we tested out are presented in the gallery below.


Refresh rates such as 24 Hz, 30 Hz and 50 Hz show improved accuracy, but 29 and 59 Hz settings are not as accurate as we would like them to be. Our earlier complaints pertaining to ease of use of the custom resolution settings still remain.
HTPC Decoding and Rendering Benchmarks: EVR / EVR-CP
In our Ivy Bridge HTPC review, we had covered the CPU / GPU utilization during playback of various types of clips. In the Vision3D 252B review, we had graphs of CPU and GPU loading with various renderers and codecs. Unfortunately, AMD doesn't provide similar data / sensors for use with their APUs. Hence, we had to resort to power consumed at the wall along with GPU loading in the Trinity HTPC review. In order to keep benchmarking consistent across all HTPC reviews, we started adopting the Trinity HTPC review methodology starting with the review of the ASRock Vision HT.
The tables below present the results of running our HTPC rendering benchmark samples through various decoders when using the Enhanced Video Renderer / Enhanced Video Renderer (Custom Presenter) (EVR / EVR-CP). Entries in bold indicate that there were dropped frames which indicate that the unit wasn't up to the task for those types of streams. Fortunately, none of the streams presented any problem to the system and there were no dropped frames. The recorded values include the GPU loading and power consumed by the system at the wall when playing back the streams using MPC-HC v1.6.5.6366 and LAV Filters 0.54.
Enhanced Video Renderer (EVR)
The Enhanced Video Renderer is the default renderer made available by Windows 8. It is a lean renderer in terms of usage of system resources since most of the aspects are offloaded to the GPU drivers directly. EVR is mostly used in conjunction with native DXVA2 decoding.
| LAV Video Decoder (DXVA2 Native) + EVR | ||
| Stream | GPU Usage % | Power Consumption |
| 480i60 MPEG-2 | 24.05 | 35.04 |
| 576i50 H.264 | 21.38 | 36.06 |
| 720p60 H.264 | 26.13 | 36.6 |
| 1080i60 H.264 | 28.9 | 39.95 |
| 1080i60 MPEG-2 | 28.19 | 37.06 |
| 1080i60 VC-1 | 31.23 | 45.57 |
| 1080p60 H.264 | 30.11 | 37.09 |
The GPU is not taxed much by the EVR despite hardware decoding also taking place. Deinterlacing and other post processing aspects were left at the default settings in the Intel HD Graphics Control Panel (and these are applicable when EVR is chosen as the renderer)
Enhanced Video Renderer - Custom Presenter (EVR-CP)
EVR-CP is the default renderer used by MPC-HC. It is usually used in conjunction with MPC-HC's video decoders, some of which are DXVA-enabled. However, for our tests, we used the DXVA2 mode provided by the LAV Video Decoder.
| LAV Video Decoder (DXVA2 Native) + EVR-CP | ||
| Stream | GPU Usage % | Power Consumption |
| 480i60 MPEG-2 | 26.69 | 38.78 |
| 576i50 H.264 | 24.43 | 37.88 |
| 720p60 H.264 | 32.76 | 40.4 |
| 1080i60 H.264 | 40.16 | 42.02 |
| 1080i60 MPEG-2 | 39.75 | 41.62 |
| 1080i60 VC-1 | 40.99 | 48.45 |
| 1080p60 H.264 | 41.33 | 42 |
In addition to DXVA2 Native, we also used the QuickSync decoder developed by Eric Gur (an Intel applications engineer) and made available to the open source community. It makes use of the specialized decoder blocks available as part of the QuickSync engine in the GPU.
| LAV Video Decoder (QuickSync / DXVA2 Copy-Back) + EVR-CP | ||
| Stream | GPU Usage % | Power Consumption |
| 480i60 MPEG-2 | 27.16 | 38.42 |
| 576i50 H.264 | 25.26 | 38.05 |
| 720p60 H.264 | 36.84 | 41.6 |
| 1080i60 H.264 | 44.2 | 43.41 |
| 1080i60 MPEG-2 | 44.32 | 43.02 |
| 1080i60 VC-1 | 43.56 | 43.26 |
| 1080p60 H.264 | 48.28 | 45.13 |
In general, using the QuickSync decoder results in a higher power consumption because the decoded frames are copied back to the DRAM before being sent to the renderer. Using native DXVA decoding, the frames are directly passed to the renderer without the copy-back step. The odd-man out in the power numbers is the interlaced VC-1 clip, where QuickSync decoding is around 5W more efficient compared to 'native DXVA2'. This is because there is currently no support in the open source native DXVA2 decoders for interlaced VC-1, and hence, it is done in software [Clarification: This restriction is only on Intel GPUs. On both AMD and NVIDIA cards, DXVA2 native decode acceleration is supported for all VC-1 streams]. On the other hand, the QuickSync decoder is able to handle it with the VC-1 bitstream decoder in the GPU.
HTPC Decoding and Rendering Benchmarks: madVR
In the preceding section, we looked at EVR and EVR-CP. Videophiles often prefer madVR as their renderer because of the choice of scaling algorithms available as well as myriad other features. In our original Ivy Bridge HTPC review, I had been very satisfied with HD 4000 and madVR except for a few corner cases involving high frame rate material which also required both luma and chroma scaling (such as 720p60 material). One of the issues in our initial testbed was that we were using DDR3-1333 DRAM. Our current system under consideration uses DDR3-1600. This is more than enough to get madVR working with default scaling algorithm settings for all video material 1080p60 or lesser. Readers interested in seeing madVR in action on the HD 4000 should definitely check out Andrew's excellent piece in Missing Remote comparing HD 2500 and HD 4000 for madVR.
It is not possible to use native DXVA2 decoding with madVR because the decoded frames are not made available to an external renderer directly. To work around this issue, LAV Video Decoder offers three options. The first option involves using software decoding.
| LAV Video Decoder (Software Fallback) + madVR | ||
| Stream | GPU Usage % | Power Consumption |
| 480i60 MPEG-2 | 70.84 | 48.19 |
| 576i50 H.264 | 72.8 | 50.41 |
| 720p60 H.264 | 75.88 | 58.23 |
| 1080i60 H.264 | 61.51 | 59.05 |
| 1080i60 MPEG-2 | 61.22 | 55.09 |
| 1080i60 VC-1 | 62.22 | 59.85 |
| 1080p60 H.264 | 73.65 | 60.91 |
The second option is to use either QuickSync or DXVA2 Copy-Back. In either case, the decoded frames are brought back to the system memory for madVR to take over. The power consumption profile improves quite a bit, particularly for the 720p60 and 1080p60 streams.
| LAV Video Decoder (QuickSync) + madVR | ||
| Stream | GPU Usage % | Power Consumption |
| 480i60 MPEG-2 | 71.37 | 47.72 |
| 576i50 H.264 | 71.28 | 49.83 |
| 720p60 H.264 | 75.76 | 54.92 |
| 1080i60 H.264 | 62.5 | 56.15 |
| 1080i60 MPEG-2 | 62.02 | 55.81 |
| 1080i60 VC-1 | 61.86 | 55.94 |
| 1080p60 H.264 | 66.31 | 56.58 |
One of the interesting features to be integrated into the recent madVR releases is the option to perform DXVA scaling. This is particularly interesting for HTPCs running Intel GPUs because the Intel HD Graphics engine uses dedicated hardware to implement support for the DXVA scaling API calls. AMD and NVIDIA apparently implement those calls using pixel shaders. In order to obtain a frame of reference, we repeated our benchmark process using DXVA2 scaling for both luma and chroma instead of the default settings.
| LAV Video Decoder (QuickSync) + madVR (DXVA Scaling) | ||
| Stream | GPU Usage % | Power Consumption |
| 480i60 MPEG-2 | 50.33 | 43.54 |
| 576i50 H.264 | 52.39 | 44.33 |
| 720p60 H.264 | 57.34 | 48.82 |
| 1080i60 H.264 | 62.63 | 55.52 |
| 1080i60 MPEG-2 | 62.34 | 55.21 |
| 1080i60 VC-1 | 62.06 | 55.51 |
| 1080p60 H.264 | 65.56 | 55.33 |
DXVA scaling results in much lower GPU usage for SD material in particular with a corresponding decrease in average power consumption too. Users with Intel GPUs can continue to enjoy other madVR features while giving up on the choice of a wide variety of scaling algorithms.
Software Interface: XBMC and JRiver Media Center 18
The combination of MPC-HC and LAV Filters enabled us to play back all our media files without issues. However, the user interface is not really amenable to a media center experience. XBMC, undoubtedly, has set the gold standard for the HTPC user interface. It is possible to go through hoops to make XBMC use MPC-HC and LAV filters for media playback, but the XBMC UI is lost during playback.
XBMC's internal playback engine incorporates DXVA capability also. It works very well for most common media files (standard TV broadcast recordings and Blu-ray/DVD re-encodes in MPEG-2 / MPEG-4 / H.264). However, interlaced VC-1 clips pose a challenge even with DXVA disabled.
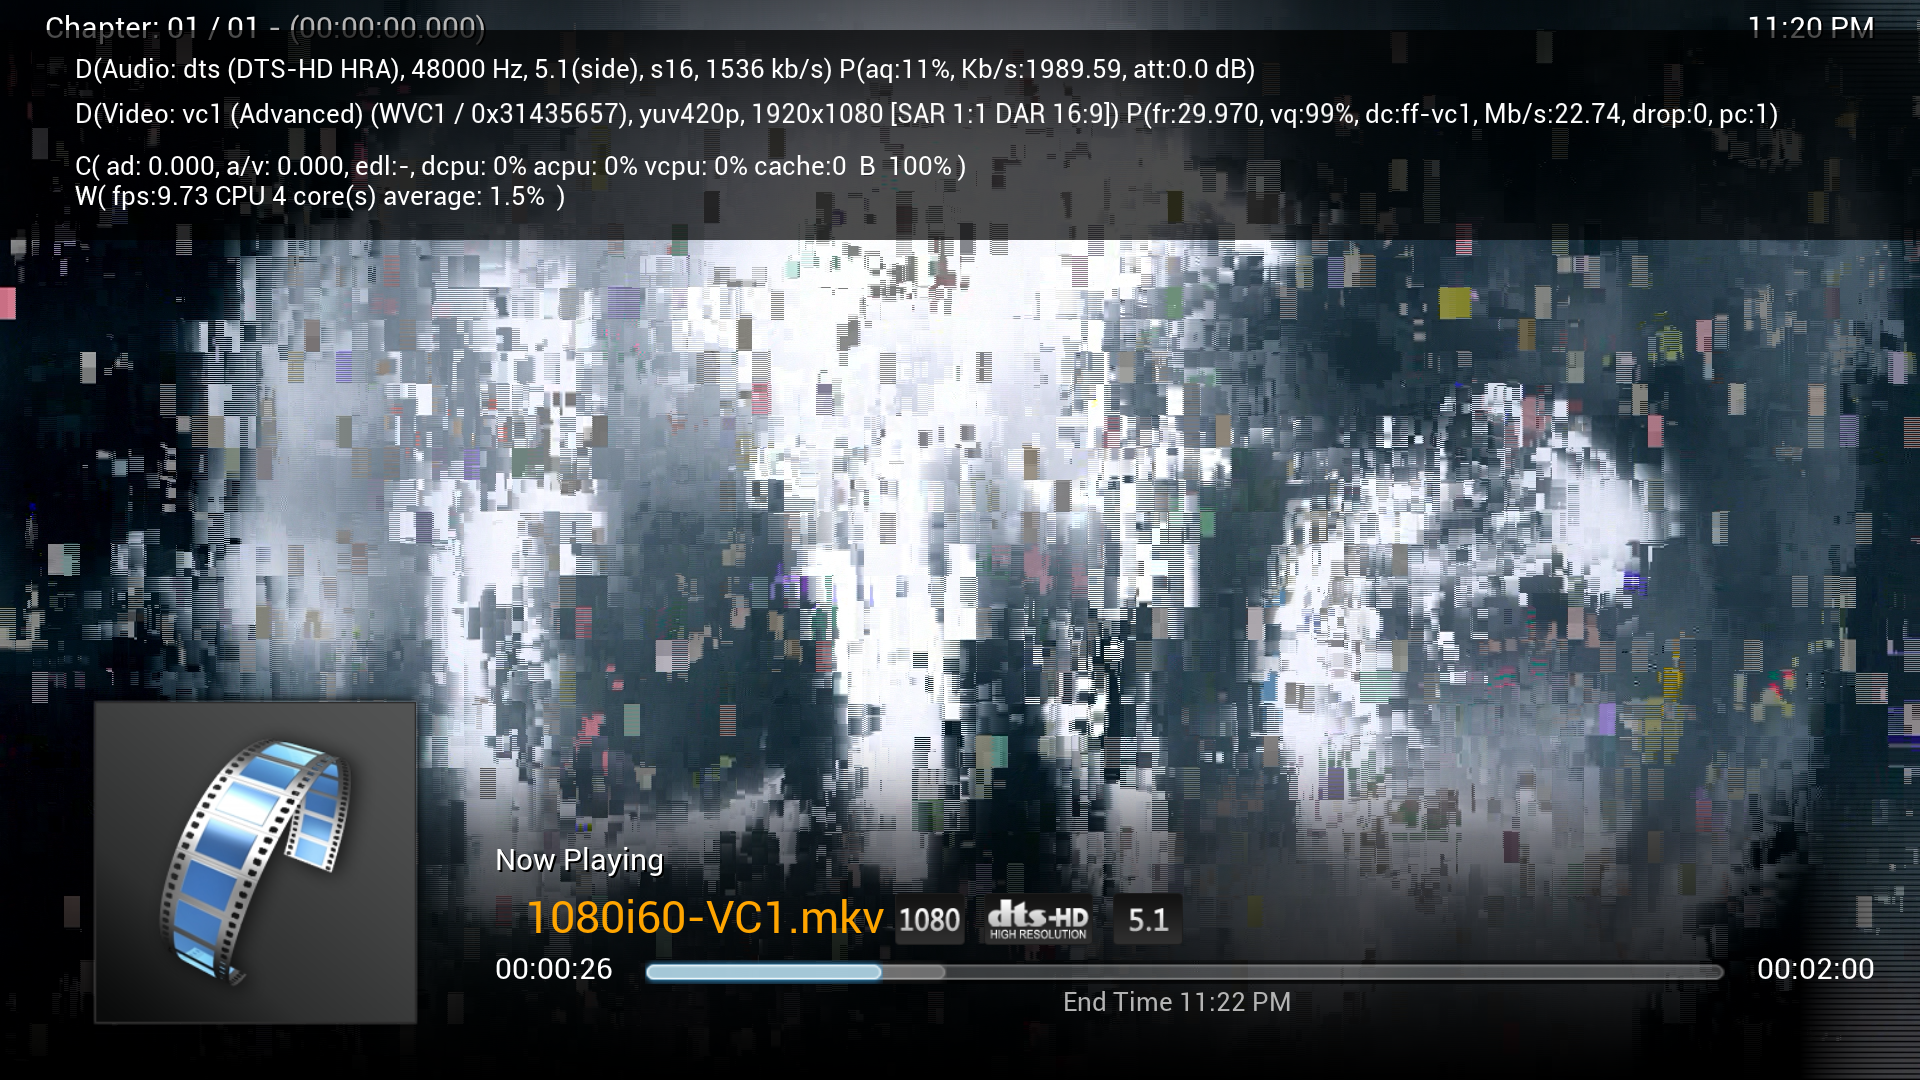
Interlaced VC-1 Playback in XBMC (non-DXVA Mode)
If you don't particularly care for madVR or don't have any interlaced VC-1 clips in your library (and don't plan to add any), XBMC is a very good choice for the software interface to a Intel-based HTPC like the one we are discussing right now.
If you have already tried XBMC, but still have unmet requirements in terms of technical capabilities, I would definitely recommend taking a look at JRiver MC18. The UI (Theater View) is a couple of notches below XBMC, but it more than makes up for the lack of eye candy and ease of navigation by completely handling the configuration of madVR and various codecs without user intervention. We have covered the Red October initiative before. On our testbed, we were able to get perfect playback of all our clips using the Red October standard profile (which doesn't use madVR).

Interlaced VC-1 Playback in JRiver MC18 (RO Standard)
From our experiments, the combination of LAV Video Decoder (QuickSync) + madVR with default settings should work without issues. A similar profile is used in Red October High Quality (RO HQ) (some of JRiver's own filters are added to the chain), but we had plenty of dropped frames during playback of 720p60 / 1080p60 / 1080i60 streams. I am in touch with JRiver to investigate this issue further and will make it a point to update this section in case the status of RO HQ on the HD 4000 changes.
Power Consumption and Thermal Profile
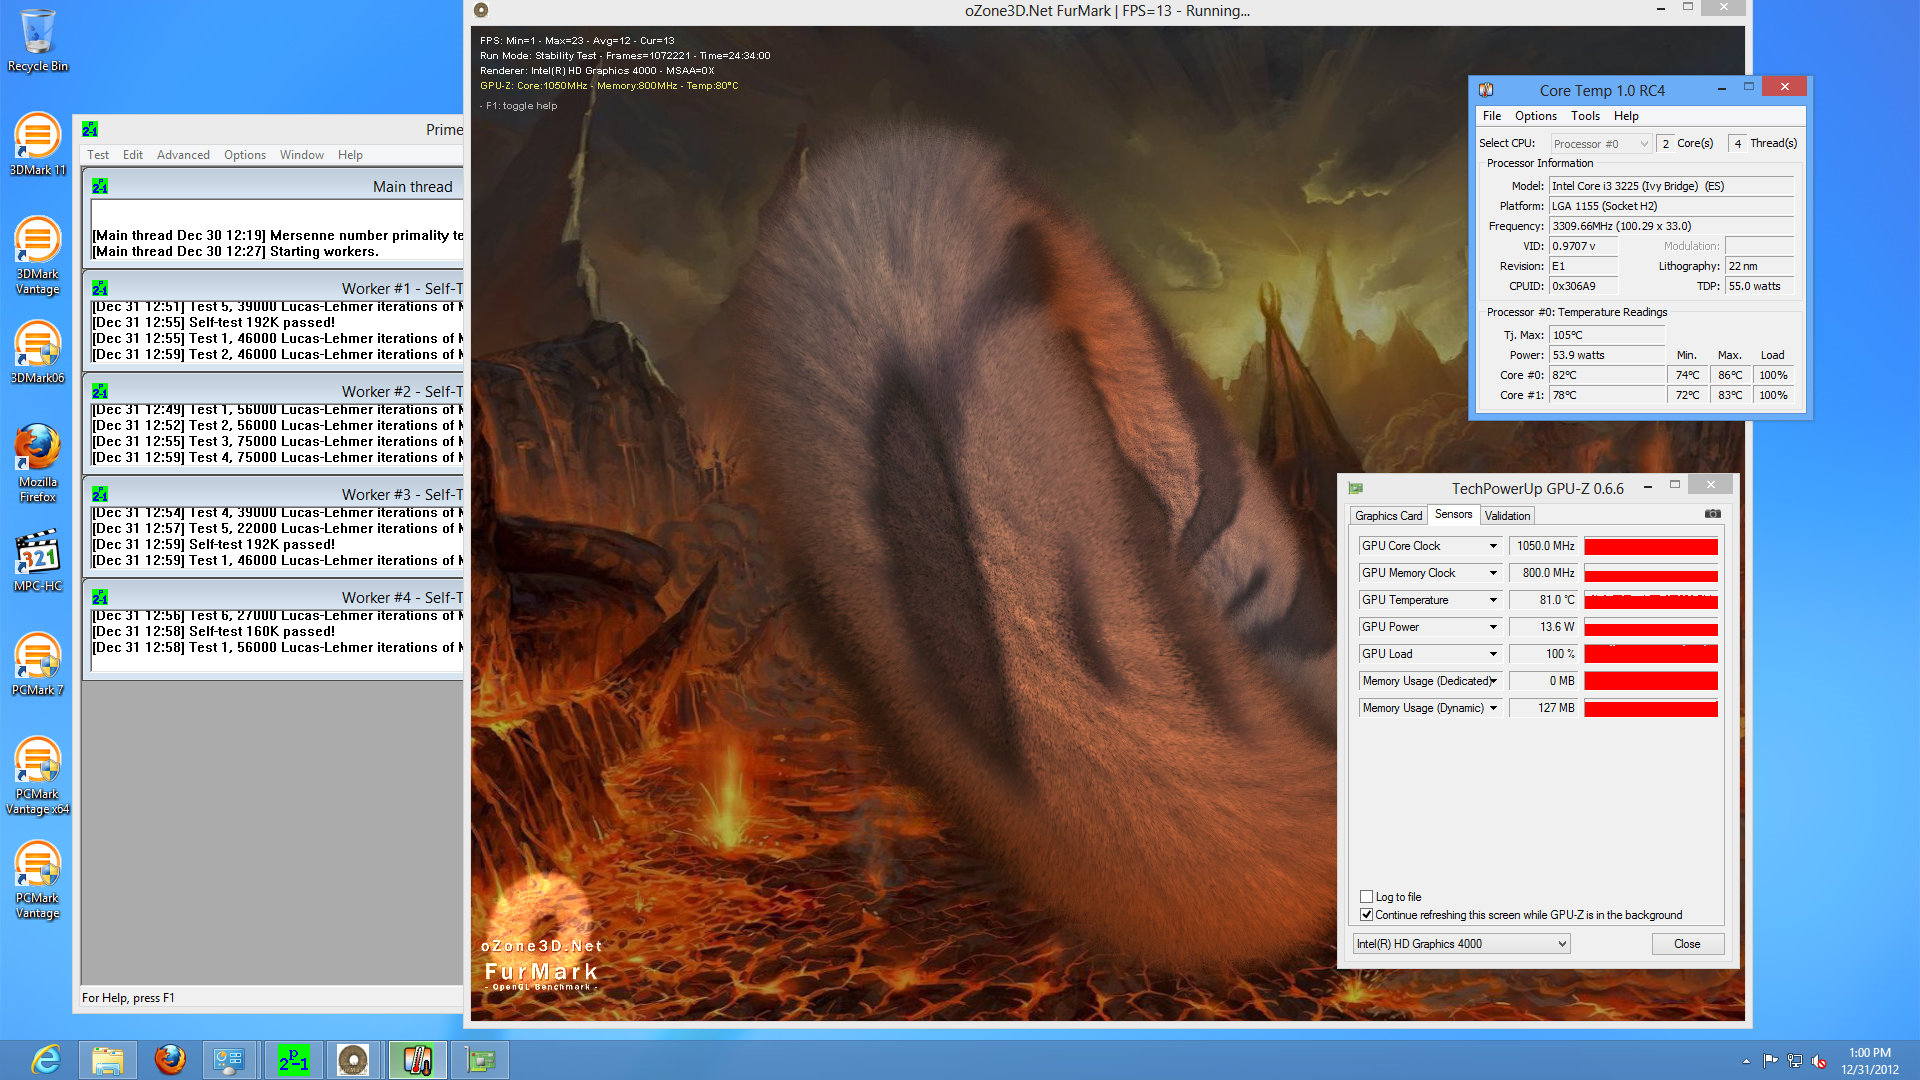
The power consumption details and case temperatures at full load were recorded in our earlier piece covering the build of the HTPC. However, we have made some updates to the system with the addition of an extra RAM stick as well as an additional SSD This time around, we decided to run a stress test with Prime 95 and Furmark for 24 hours. As can be seen below, CoreTemp reports that the core temperatures went as high as 86 C before settling down to around 80 C. The TDP rating of the Core i3-3225 is 55W, and CoreTemp reported between 53.8 W and 54.6 W throughout.
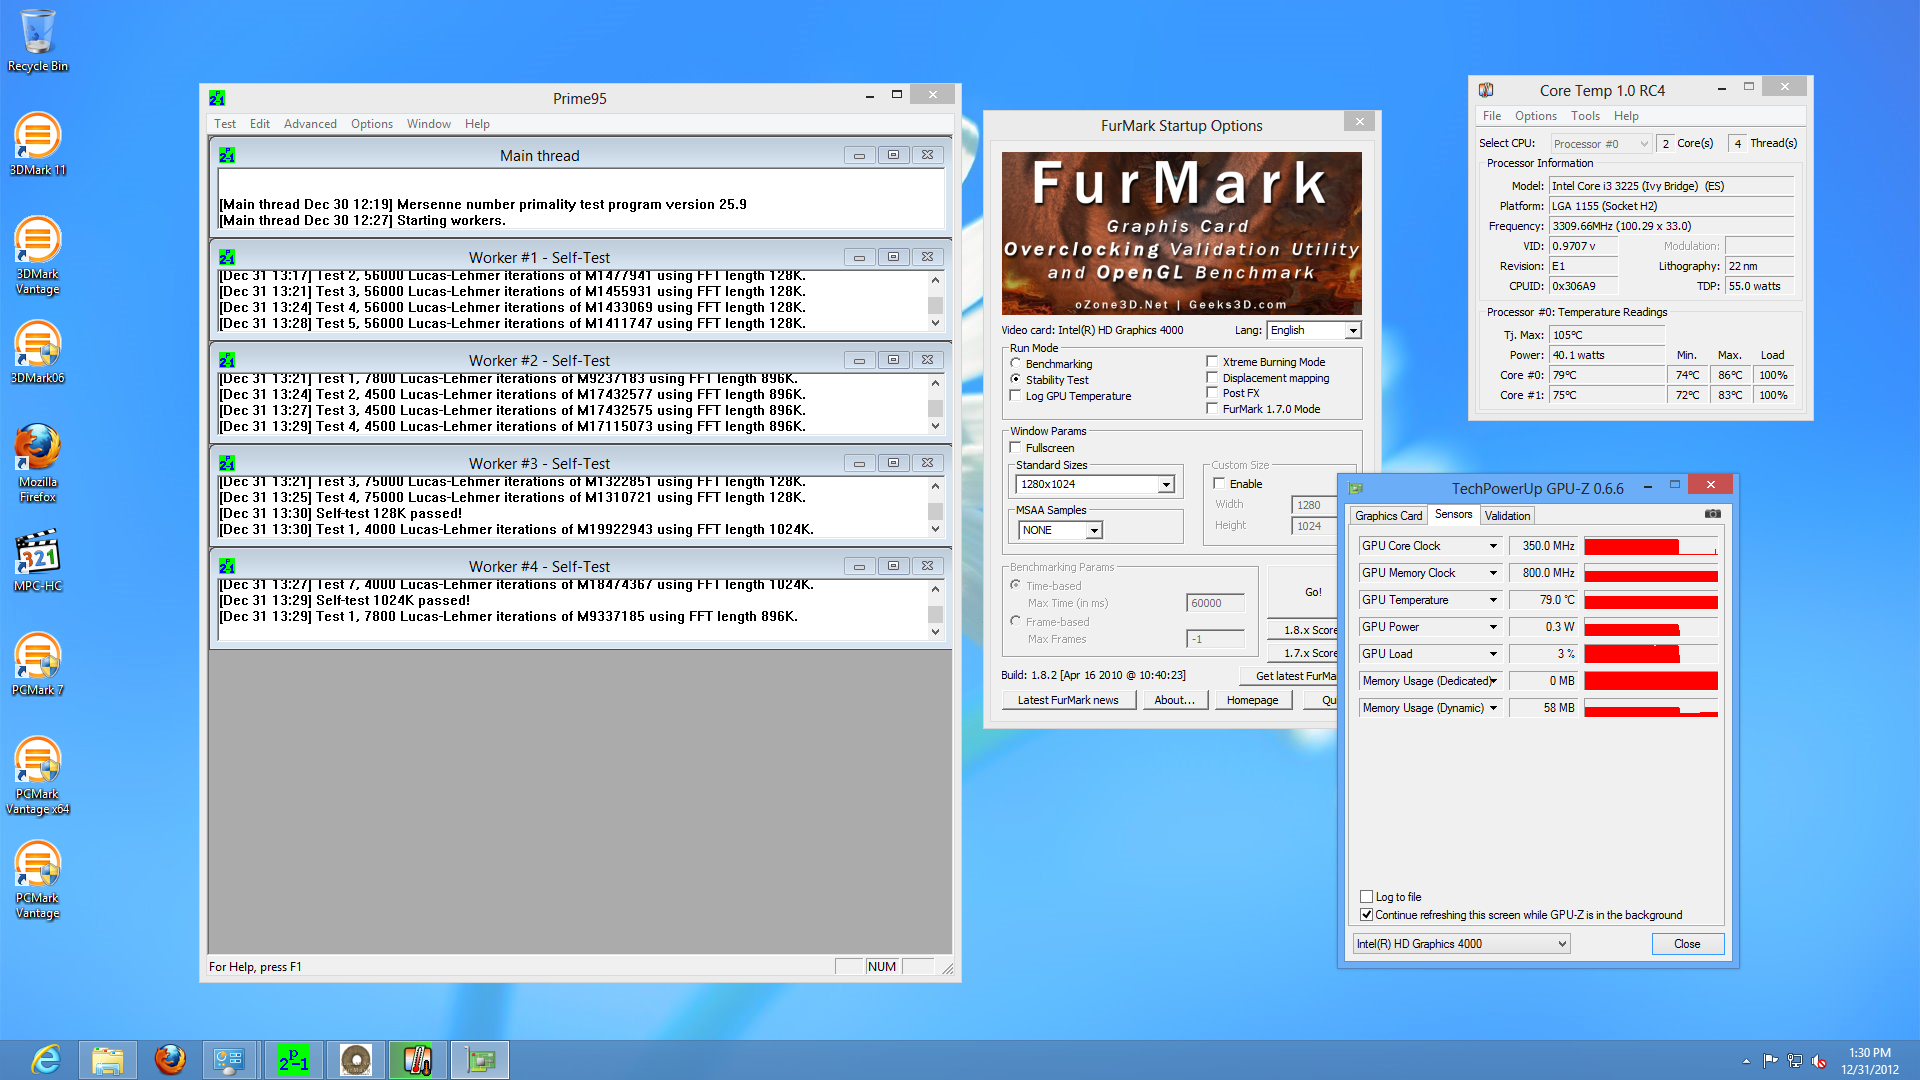
We removed the GPU loading and let Prime 95 alone run for some time. With almost no load on the GPU, the power consumed by the processor jumped down to around 40 W. This thermal budget allocation is pretty interesting, with less than 30% allocated to the GPU and the rest to the CPU. The i3-3225 doesn't have a Turbo mode, and hence, it is unable to take advantage of the headroom offered by the idle GPU.
Average power consumption numbers for various scenarios are presented in the table below. Unless explicity specified, the specified scenario was tested using Windows 8 Pro x64.
| Passive Ivy Bridge HTPC (Core i3-3225 / Asus P8Z77-I Deluxe) Power Consumption | |
| Windows 7 - Idle (Display off) | 27.71 W |
| Windows 8 - Idle (Display off) | 24.86 W |
| Windows 7 - Idle (Display on) | 28.02 W |
| Windows 8 - Idle (Display on) | 26.66 W |
| Sleep | 2.00 W |
| Prime95 v25.9 + Furmark (Full loading of both CPU and GPU) | 88.75 W |
| [Updated: New!] Prime95 v27.7 + Furmark 1.10.3 (Full loading of both CPU and GPU) | 89.77 W |
| Prime95 v25.9 (Full loading of CPU only) | 58.25 W |
| [Updated: New!] Prime95 v27.7 (Full loading of CPU only) | 62.56 W |
| 1080p24 H.264 Blu-ray Playback from ODD - CyberLink PowerDVD 12 | 38.15 W |
| 1080p24 VC-1 Blu-ray Playback from ODD - CyberLink PowerDVD 12 | 37.64 W |
| 1080i60 VC-1 Blu-ray Playback from ODD - CyberLink PowerDVD 12 | 39.73 W |
| 1080p24 VC-1 Blu-ray ISO Streaming from NAS - CyberLink PowerDVD 12 | 34.78 W |
| 1080p24 H.264 MVC Blu-ray ISO Streaming from NAS - CyberLink PowerDVD 12 | 37.86 W |
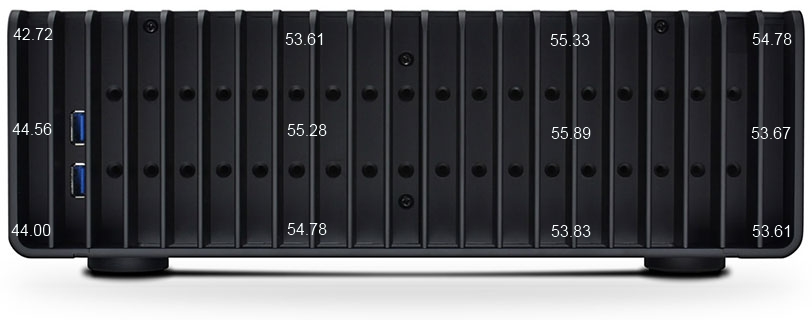
In our initial piece, we had noted the case and heat sink temperatures in the Fahrenheit scale. Since the configuration has changed (and the system consumes more power now), we have refreshed the case / heat sink temperature figures below. We have also shifted to the Celsius scale, as requested in some of the reader comments.
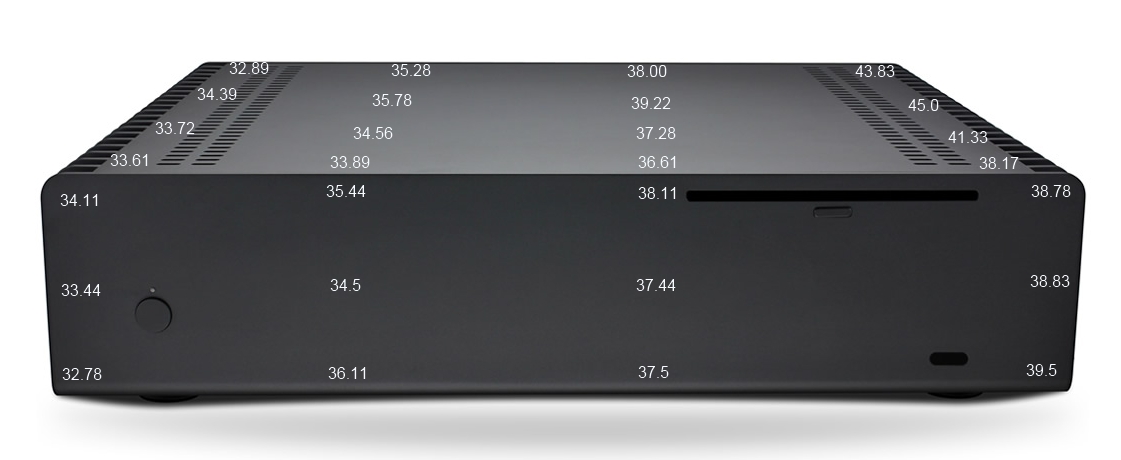
Chassis Temperature in C (Top and Faceplate) after 24 Hours of Full CPU / GPU Loading
Chassis Temperature in C (Side Bolted to the Heat Sink) after 24 Hours of Full CPU / GPU Loading
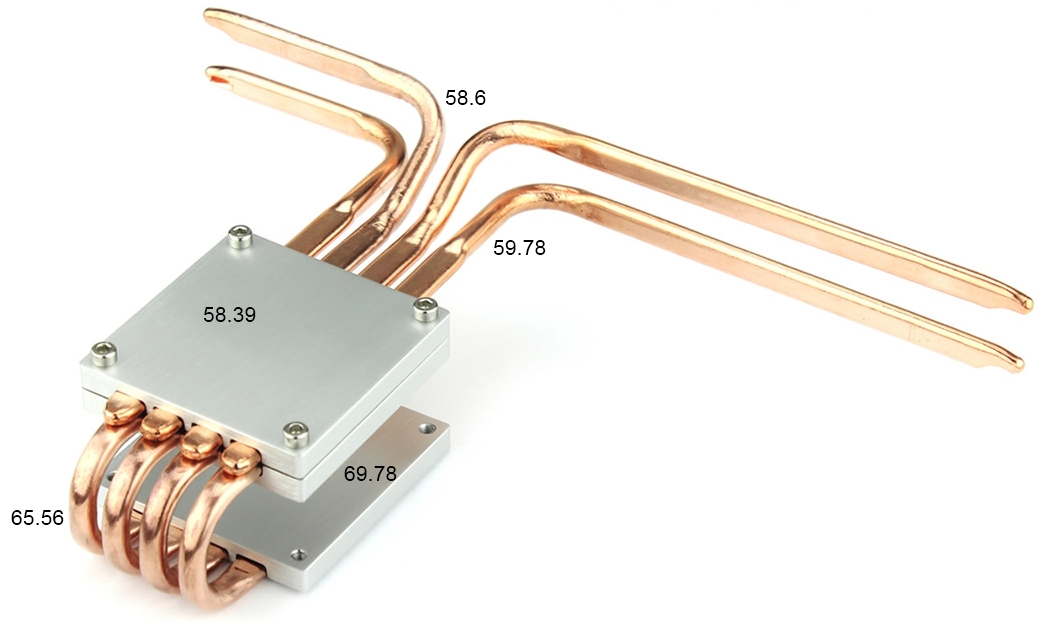
Heat Sink Assembly Temperature in C after 24 Hours of Full CPU / GPU Loading
Concluding Remarks
Our experience with a passive Ivy Bridge HTPC has brought to fore many interesting aspects. On the surface, Windows 8 doesn't have any capabilities to tempt users to upgrade. In fact, the removal of Windows Media Center and presenting it as a separate $10 upgrade has actually served as a deterrent for many HTPC users. I would strongly suggest HTPC users relying on WMC (irrespective of the OS) to move on to other platforms. However, a few days of using Windows 8 as our primary HTPC OS has completely altered our opinion.
Overall, Windows 8 seems to be a very efficient OS (in terms of boot time as well as power consumption). GPU acceleration for video decode and playback is very well integrated and acts in an effective manner for all types of streaming services (including Netflix and YouTube). Not only do we get higher quality material delivered to the Netflix app, the power consumption during playback is actually a full 15 W lower. XBMC and JRiver MC18 work without issues on Windows 8.
The Intel HD 4000 GPU is quite capable of madVR with the default scaling algorithms as long as it is paired with DDR3-1600 DRAM. On our system, we were able to get madVR working without issues. The DXVA scaling feature of madVR enables users to get good scaling quality in a power efficient manner, thanks to the hardware scalers in the HD 4000 GPU. Of course, the GPU is going to struggle with advanced scaling algorithms. We will cover that (along with 4K decode and display performance) in the third and final installment of our HTPC series. The concluding piece will pit the latest passive HTPC GPUs from AMD and NVIDIA against each other and provide readers with the insights on what exactly they have to offer over the Intel HD 4000 GPU.


